Service graphs
Graph Information
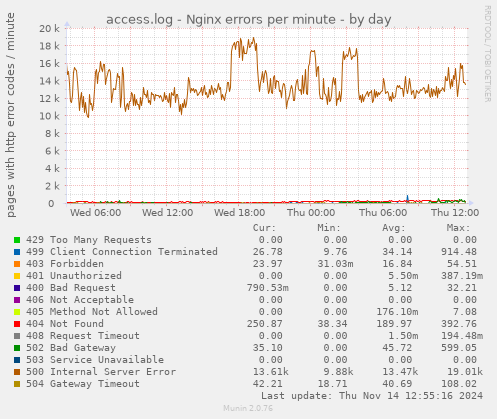
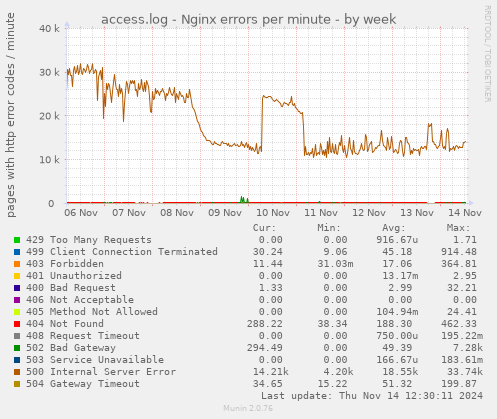
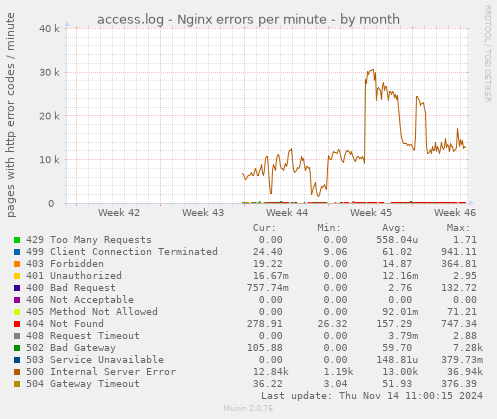
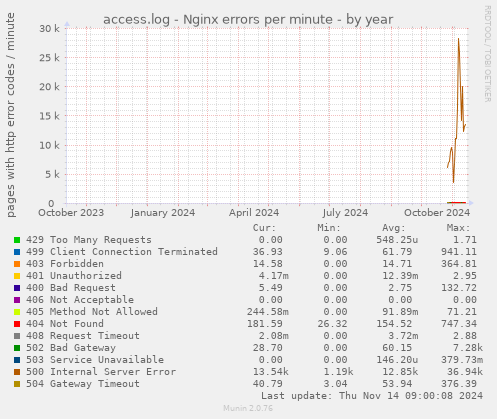
This graph shows nginx error rate per minute
| Field |
Internal name |
Type |
Warn |
Crit |
Info |
| 429 Too Many Requests |
error429 |
derive |
|
|
|
| 499 Client Connection Terminated |
error499 |
derive |
|
|
|
| 403 Forbidden |
error403 |
derive |
|
|
|
| 401 Unauthorized |
error401 |
derive |
|
|
|
| 400 Bad Request |
error400 |
derive |
|
|
|
| 406 Not Acceptable |
error406 |
derive |
|
|
|
| 405 Method Not Allowed |
error405 |
derive |
|
|
|
| 404 Not Found |
error404 |
derive |
|
|
|
| 408 Request Timeout |
error408 |
derive |
|
|
|
| 502 Bad Gateway |
error502 |
derive |
|
|
|
| 503 Service Unavailable |
error503 |
derive |
|
|
|
| 500 Internal Server Error |
error500 |
derive |
|
|
|
| 504 Gateway Timeout |
error504 |
derive |
|
|
|


