Service graphs

|

|

|

|
Graph Information
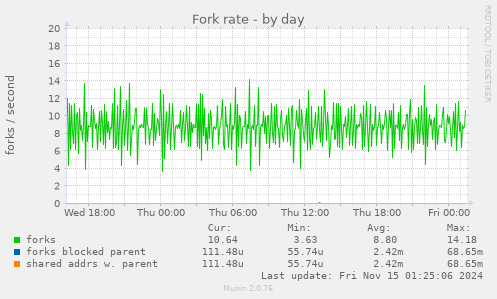
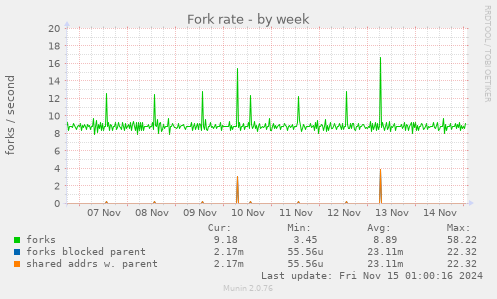
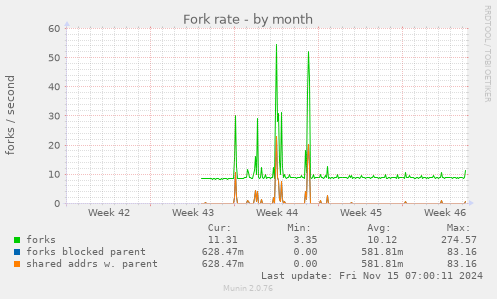
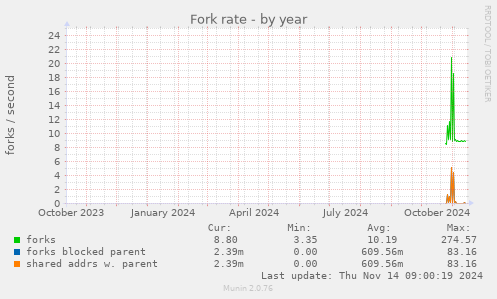
This graph shows the number of forks (new processes started) per second.
| Field | Internal name | Type | Warn | Crit | Info |
|---|---|---|---|---|---|
| forks | forks | derive | The number of forks per second. | ||
| forks blocked parent | forkblk | derive | The number of forks which blocked the parent process. | ||
| shared addrs w. parent | forksh | derive | The number of forks which shared address space with the parent process. |